home > News > 201-18 Brief introduction of porosity curve of fisher sub sieve sizer average particle size tester
201-18 Brief introduction of porosity curve of fisher sub sieve sizer average particle size tester
201-18 Brief introduction of porosity curve of fisher sub sieve sizer average particle size tester
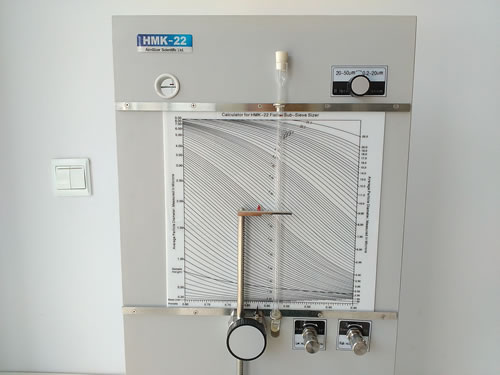
The porosity curve is plotted on the reading board of the fisher sub sieve sizer average particle size tester. To be precise, this is not a porosity curve, but a curve that the sample height changes with porosity. When samples of different specific gravity are measured, there is a specific demand for the height of the sample, and the various heights form a curve.
Fisher Sub Sieve Sizer https://www.labulk.com/hmk-22-fisher-sub-sieve-sizer/
Prev: 303-7 The English Name of Hall Flowmeter?
Next: 303-6 What is relationship between National Standard GB 1482 and international standard ISO 4490 in the hall flowmeter related standards?
Next: 303-6 What is relationship between National Standard GB 1482 and international standard ISO 4490 in the hall flowmeter related standards?
Leave a Reply
- Links: